LOGISTIC REGRESSION IN R
LOGISTIC REGRESSION IN R

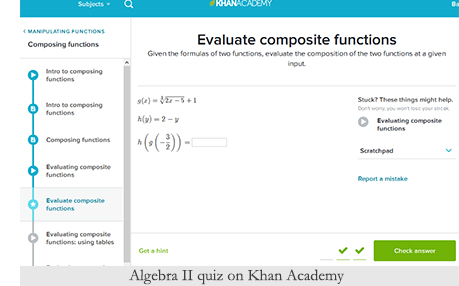
I finished geometry and I’m onto algebra II! I like algebra. A lot. It just makes sense to me. Not that geometry doesn’t make sense, but I feel that it requires more memorization of rules and formulas. Algebra requires its fair share of that as well, but it’s more logical.
I don’t know. Maybe I’m crazy, but that’s a discussion for another day.
This past week was a little weird. I wasn’t able to focus on my coursework as much as I usually do because a lot of things kept coming up. I still worked on it, but I don’t feel as accomplished this week as I have on previous weeks.
I finished week 3 of The Analytics Edge from edX, although I am still working on the final homework assignments. We studied logistic regression, which is basically a fancy way of determining the probability of something occurring. It’s a similar formula, but I prefer the linear regression from last week a little more.
We worked on some pretty significant studies in the world of data science and analytics: The Framingham Heart Study and election forecasting.
Framingham Heart Study
The Framingham Heart Study is a generational study beginning in the 1940s conducted in, you guessed it, Framingham, Massachusetts. They identified potential risk factors for coronary heart disease (CHD) to predict the probability that someone would develop CHD. CHD is a form of heart disease that has been the leading cause of death since 1921, so finding the possible causes was of great importance to the researchers and changed the medical field in many ways.
Some of the risk factors they looked at were the sex of the patient, smoking (not known to be a risk of heart disease at the time), hypertension, cholesterol, and blood pressure, among others.

Interesting fact about Franklin Roosevelt I learned was related to his blood pressure. One year before his death, his blood pressure was 210/120. Today that would be called hypertensive crisis and emergency care is needed, however his personal physician said it was slightly high, but normal for a man his age. Two months before he died it was 260/150 and the day he died it was 300/190.
It’s not his physician’s fault. People at the time weren’t aware of normal blood pressure levels and there were no safe medications to treat it.
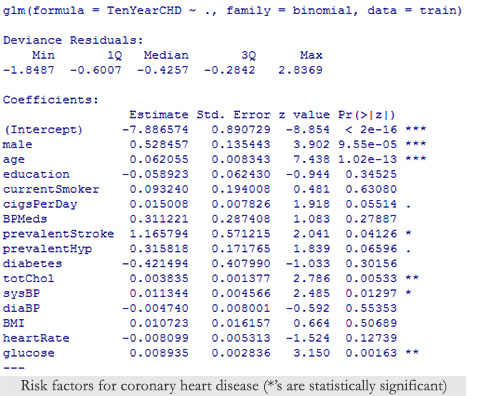
Anyway, we used data from the Framingham Heart Study to determine which risk factors were statistically most likely to cause coronary heart disease. This study has had implications throughout the medical field.
There were some problems with the sample of patients in the study that required additional studies to be conducted. The sample was mainly white, middle class people who had lived in Framingham their whole lives. Different ethnicities can have different risk factors. However, modifying the regression model usually gives an accurate prediction of CHD.
This study used analytics to save lives. How amazing is that? I love data science that is being used to help people.
Election Forecasting

The next data set we analyzed isn’t vital to anyone’s life, but it was interesting nonetheless. Based on polling data from presidential elections, we were able to make a nearly perfect (1 mistake) prediction on which nominee would win in each state during the 2012 presidential election. The model was developed by Nate Silver, and we worked with the numbers during the lessons to create the most accurate model.
No, I can’t predict this year’s election because the polling data doesn’t exist yet. It doesn’t matter either way because I’m voting for Pinestraw (it’s a joke, relax!).
So those are some of the things I learned this week! The homework assignments at the end of the week are pretty extensive and I still need to go back through my notes to remember the code needed to answer some of the questions. I’m glad the quizzes are so extensive because it ensures you know what you’re doing before moving on to the following lesson.
Digression (unrelated to my current studies)
Right now, Khan Academy is launching an Indiegogo campaign in order to create courses on United States history. I think that’s going to be another great learning resource on the site for students.
I’m going to digress a bit here.
From primary through high school, I absolutely despised history. It wasn’t until taking history classes in college that I truly appreciated it. College-level American history is funny, scary, sad, violent, controversial, and exactly how it should be taught in earlier years.
I’m not one of those people who says everything we read is a lie, but a lot of the history in my younger years was misleading or altogether wrong. I’m not sure if it’s still taught this way in public schools, but we learned Christopher Columbus discovered America. No, no he did not. Or people of his time thought the earth was flat. Not true, most educated people knew the earth was round long before Columbus’ voyage. Also the idealized version of Thanksgiving. Just, no.
Those are a few of the many historical inaccuracies I could think of off the top of my head that are taught completely different in college textbooks and classes. It’s like administrators decided long ago that kids couldn’t handle the facts about history. They all but omitted the causes of wars and events, peoples’ feelings about it at the time, and the ramifications of said event.
It seems that anything controversial or unpleasant is removed from grade school texts. Presidents are seen as heroes, wars are always justified, and the U.S. has never made a mistake. Don’t get me wrong, I am proud to live here, but the U.S. is not and has never been perfect.
History can be incredibly fascinating and I believe the way it’s taught to kids today completely turns them off to the subject.
The other issue, as far as I’m aware, is that each state has their own guidelines about what can be taught or which side of specific events can be shown, or if they can be shown at all. This deprives students from understanding history as a whole and learning from the past, which is incredibly important.
I wrote all of that to say that I hope the new history classes will be taught in such a way that will inspire others to continue to learn more. Khan has an amazing group of teachers, researchers, and staff, so I’m confident they’ll be good.
Thank you for following along. I began this journal intending it to be my shortest one yet and I think it’s the longest. I blame my lack of sleep, but I hope you found it insightful/inspirational/interesting. I’ll see you next week!

Author and hobby digital artist. Barry aspires to become a data scientist and better himself as a person.