LINEAR REGRESSION IN R
LINEAR REGRESSION IN R
I still absolutely love The Analytics Edge from edX. I couldn’t recommend it more for anyone interested in the field, but allow me to recommend it a bit more anyway!
I began linear regression during week two. Statistics is a big part of analytics and most of data science. It allows you to compare values to determine if variables are correlated. Then you can deduce if one causes the other, or if there are other underlying factors at work.
That is the idea behind linear regression. It tests the statistical likelihood that something is correlated in order to predict whether or not an action will occur.

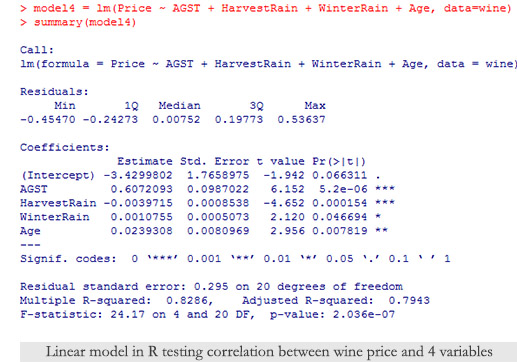
During the first lesson of the week, we used linear regression to predict the quality of wine based on a model developed by Princeton economics professor, Orley Ashenfelter.
Now we’re speaking my language! You can use statistics to determine the quality of wine. Who says you never use math after school? Granted, it’s more fun to taste the wine, but if there is a more objective and accurate test, it would be better for wine makers and for those who enjoy drinking said wine.
The goal of the model was to create a predictive line through data involving dependent (price of wine) and independent (rainfall, temperature, etc) variables. It was shown that Ashenfelter was able to make better predictions about the price of wine than a renowned wine expert.
I have several friends who are sommeliers, and I absolutely see the need for experts in their field. This model was more geared toward determining what the price the wine should be based on outside influences.
We also learned about sports analytics this week as it pertains to baseball and basketball. Using just a few stats, we could determine who the best player for a team would be, and the likelihood that team would make the playoffs. Those stats usually differed from what recruiters found important.
It was started with the Oakland A’s, but now most sports teams use some type of analytics to have a well-rounded team. Pretty cool stuff!

The greatest part of this class is the number of different topics we are covering. It really opened my eyes to how many fields data science and analytics can play an important role in. It’s not going away and it will continue to be an important career for quite some time. I just hope it will still be viable by the time I have completed my studies.
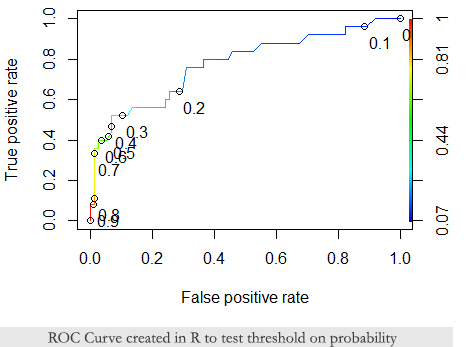
We began logistic regression for the third week of the course, which determines the probability of something occurring. We used patient care information in the first lesson to decide the probability that patients would receive good or poor care using a bunch of statistical calculations and plotting.
All of this is done in R, which is really exciting. I fear that I made it all sound rather dull, but the possibilities are endless. If you can think of anything that involves a ton of data that you want to make a prediction about, data science and analytics can probably do it.
The class is taught well and you basically work in R entering code alongside the instructor.
Math

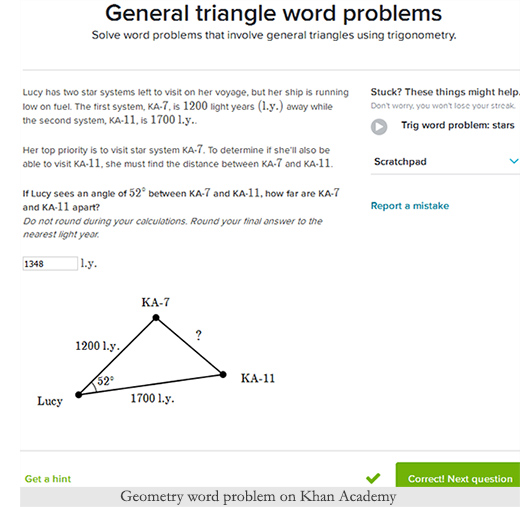
Last week I thought I would be finished with my geometry class on Khan Academy by now. Unfortunately, the lessons on trigonometry and circles were far more extensive than I realized. Both of those lessons each took me two days to complete.
That said, geometry is almost complete with three topics left to learn. By next week, I will have begun algebra II.
That only leaves statistics, trigonometry, precalculus, differential calculus, integral calculus, multivariable calculus, differential equations, and then linear algebra!
Um. . . ugh
This, and this alone is why I hadn’t started my studies earlier. It was completely daunting to look at how much I needed to learn before I could even begin any type of advanced programming courses.
It is also why I try not to look at it this way any longer. I’m progressing through my math courses fairly quickly. Algebra took about 2 months, although it would have been much quicker had I not attempted to receive my mastery achievement. The mastery involves quiz after quiz on all topics in the class for hours on end with minimal progress. Geometry will have taken me exactly one month to complete.
I know the more advanced courses will take longer because I won’t be able to fly through it, but I am feeling good about my progress thus far.
Also, there is debate on whether or not any of the calculus classes are necessary for linear algebra or programming. I haven’t researched it fully yet, but I have plenty of time to do so and I’ll let you know what the verdict is on a future post. If I don’t need to take calculus, that will move my progress along even faster. We’ll see!
That is where I am at! I normally try to spend between 3 – 4 hours on my coursework per day. Sometimes more, sometimes a little less. I usually take Wednesdays off to write my journal, update my website, and accomplish some other things.
I love learning, so there’s no sign of slowing down yet. I miss school and this is getting my brain back into that mindset. I have always wanted to go back for my master’s degree, but I can’t afford to at this time. Right now, I’m happy with these classes, and the fact that they are free is even better!
Thank you for following me. I hope you are following your dreams wherever they take you! I’ll see you next week.

Author and hobby digital artist. Barry aspires to become a data scientist and better himself as a person.