MACHINE LEARNING SPECIALIZATION
MACHINE LEARNING SPECIALIZATION
I began my machine learning course this week and I love it! So far, it’s so much better than I expected. I’ve also begun precalculus. Two steps in the right direction and I’m that much closer to my dreams!
Machine Learning
The Machine Learning Specialization from The University of Washington on Coursera is a 6 course (or 5 classes and the capstone) concentration introducing students to the world of machine learning.

It’s taught by Carlos Guestrin and Emily Fox, who are both Amazon Professors of Machine Learning at the university. Carlos is in the computer science department, while Emily is in statistics. They are both amazing! They’re engaging, insightful, and funny. They developed a truly innovative Massively Open Online Course (MOOC) that’s both educational and fun. Carlos even made a Doctor Who reference at the start, which I enjoyed.
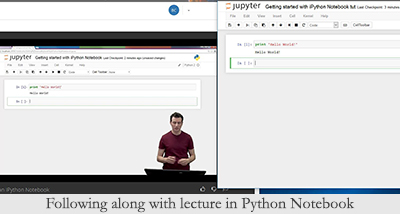
Unlike other MOOCs that I’ve taken, you see the professors in all the videos, whether they’re going over slides or typing code. It’s not necessary, but it makes it feel more like an actual classroom and I like it. In the beginning, they discuss the class together, then they split up and teach different subjects separately.
In the specialization, they go from use cases to models and algorithms. This is the opposite of many machine learning courses that teach algorithms first, which can make it difficult to apply to real world situations. I think using case studies is important to get a grasp of how algorithms can be used. I feel as though it would be easy to get lost in all the coding if you didn’t learn about real world applications.
The motto for the specialization is: Tough concepts made intuitive and applicable
They want us to understand at a very intuitive and practical level some very important machine learning algorithms and think about ways to deploy them in new problems.
Prerequisites
Hearing the prerequisites for the courses did raise some concerns. Basic calculus (derivatives) and basic linear algebra (vectors, matrices, matrix multiplication) are required, in addition to knowledge of a programming language.
I am at least familiar with vectors and matrices, and we used them in my previous analytics class, so hopefully I’ll be okay. Also, there are two pretty extensive lessons in precalculus that I’ll be studying this month, which will help. As far as programming knowledge, I’m hoping my limited R studies will be sufficient. At this point in the class, I don’t think prior programming knowledge is absolutely critical, but it is helpful. The way they teach the class, they don’t assume you know how to create algorithms and they go step by step through the code. In the forums, I have noticed some people having trouble or not understanding the reasons for certain things, such as training and test sets, which make sense to me from my previous class. We’ll see how it goes as the classes get more advanced.
First 3 "Weeks"
The first class in the specialization uses case studies to build a foundation in the subject. It focuses on building, evaluating, and deploying intelligence in each case study, rather than learning any algorithms just yet. I completed 3 weeks of the class this week. In fairness, this is an introductory course and each “week” only touches on what we’ll be learning in detail in future classes.
We started off discussing some case studies where different machine learning techniques are used, such as regression, classification, or clustering. It helped that I was familiar with most of these methods from The Analytics Edge on edX. Like analytics, it uses real world scenarios to explain the techniques we’ll use, but it goes beyond statistical analyses and obviously it will be more in depth because it spans several classes.
We set up Python and GraphLab Create, and became familiar with some of their functions. The second week covered regression, followed by classification in the third week.
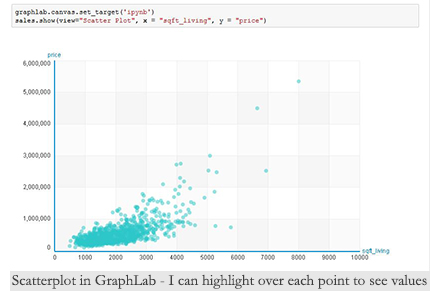
The case study we used in the regression lessons were house price predictions in King County, Washington. As an aside, this is my dream home location. This is very similar to what I did in analytics, except we used Python instead of R here.
During week three, we created a classification model using sentiment analysis. We looked at the reviews of a giraffe baby chew toy and attempted to predict whether a review was positive or negative based on the words in the review. Again, we conducted similar analyses in The Analytics Edge. I did enjoy that Carlos actually had the giraffe with him during the lecture. We read some of the negative reviews and at least one person stated how bad the giraffe smells. Carlos then smelled it and said, “It smells okay to me.” I don’t know why, but that cracked me up.
Python
I am completely sold on Python, especially when used in conjunction with the Jupyter Notebook and GraphLab Create.
According to the professors, “Python is widely used in the industry, and is becoming the de facto language for data science in the industry. R tends to be significantly less scalable than Python and has very few deployment tools, thus it is seldom used for production code in industry.”
This is great to know and makes me feel better about switching to Python for this specialization. I was surprised to hear that R is less scalable and has few deployment tools considering how many packages are available for it, but if that’s the case, then all the better that I’m learning Python.
I mentioned this a couple weeks ago, but R does have a much steeper learning curve than Python. I had originally wanted to begin with Python for that reason, but I decided it would be better to learn a more difficult programming language and I thought R was more widely used in the data science field.
I did a quick search to see what others prefer for machine learning and data science and it’s pretty mixed. Most people say that R has better graphics packages, such as ggplot2, for visualizations, but that hasn’t been my experience thus far. Don’t get me wrong, I think ggplot2 is amazing. That’s what I used to create the awesome heatmaps and graphs during my Visualization week.
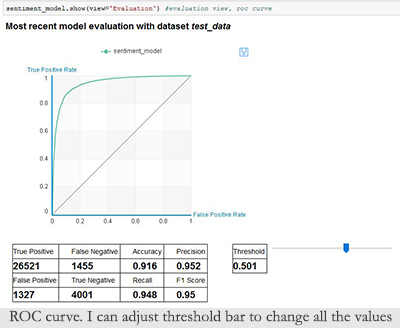
However, dare I say GraphLab Create makes even better visualizations? At least for statistical analyses. I haven’t used it to create maps and I’m unsure how it functions for that. What I really like about the standard histograms and ROC curves, are that they’re in color and customizable in the program. With R, I always had to retype the code with a new threshold value to see how it would change the accuracy of a prediction model. In GraphLab, you can move the slider left or right and it changed the values in real time without any additional code.
GraphLab Create is free for academic use, but you have to pay a license if you want to use it for commercial purposes. I’m not sure how much the license it, but I’m sure it’s worth it. Fortunately, I don’t have to worry about that for a while because I’m only using it for educational purposes.
Besides the graphical interface, I also prefer Python when used on the Jupyter Notebook. In R, if you make a mistake, it gives you an angry error message and you have to retype the code (or copy and paste with revisions). But that error message and mistyped code remains as a blemish in your R console. In the Python notebook, but can return to any line of code and change whatever you want. If you make a mistake, fix it and the error code disappears.
This is only true in the notebook. In the command prompt, it’s impossible to change previously entered commands. But there’s no reason not to use the notebook. R has RStudio, but I never really used it because I wasn’t that much of a fan.
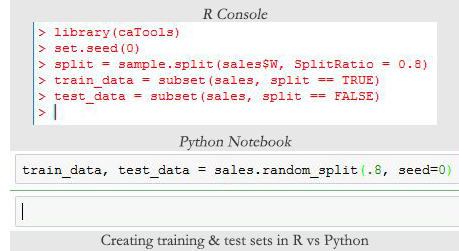
I also like how streamlined some of the codes are compared to R. For example, in Python, I can split a dataset into a training and test set and add a seed all in one line of code. It takes five lines of code to do the same thing in R. FYI: A seed allows you to be able to recreate a prediction with the same results; it’s necessary when following along in a lecture or doing an assignment.
I’m still getting used to the new commands, however. I keep wanting to type nrow() to find out the number of rows in a dataset. Python, like R, has several different ways of doing the same thing. I have to relearn a lot of things, but I already prefer Python for all of these reasons. It just looks so much nicer. Don’t judge me, we’re a visual species!
Capstone
We learned a little about the capstone project for the end of the specialization and I couldn’t be more excited.
We will deploy an intelligent web application that combines text data, image data, text sentiment analysis, and deep learning. It’s going to be a recommender system that analyzes product images and text sentiment to decide on recommendations.
I’m going to be able to create that (in 6-8 months)! Are you kidding me? So cool!
Financial Aid
I’m a little ashamed to admit this, but I finally decided to apply for financial aid for my first course. I don’t like getting handouts; I only do this because I truly can’t afford the classes and I really want to experience every aspect of the class. It’s too good not to take in full. I went through the first two weeks of the class before deciding to look into Coursera’s requirements.
Prior to doing so, I could see the quiz questions, but I couldn’t check to see if my answers were correct without paying for the course. On edX, you can check your answers immediately. I don’t see how preventing this will encourage more people to pay, since I doubt there are very many people like me who get upset about things like that. I imagine the Coursera executives sitting in their mountain lair: “Muah ha ha look at all the peasants taking quizzes for no reason. They haven’t even paid! This will force their hand.” I’m sure the Coursera execs aren’t evil overlords inside secret mountain facilities, but it makes me laugh to think about.
And I’m honestly not against paying for my education. I did graduate from a brick and mortar institution and loved it. However, I do believe everyone in the world should be entitled to a quality education, despite their background. And I am against for-profit schools. I will say, so far this class is breaking the mold on my thoughts about Coursera. They don’t create the classes, so of course there can be great ones, but they do put limits on what you can access. I feel like a broken record, but I feel strongly about this.
As it turns out, Coursera actually believes everyone should have access to an education as well. According to one of their creators (previously labeled evil overlord), money isn’t the driving force behind his philosophy and he wants those who cannot afford to pay to be able to obtain certificates. I answered the required questions and I was immediately granted full access to the class while they read my responses. So far, my access hasn’t been revoked, which is awesome. You are required to pay if you don’t complete the class in the allotted amount of time, but I have every intention of finishing it.
I didn’t expect to be able to get a certificate for the course but it looks like I will and I’m thrilled. If I can get the specialization certificate, I’ll be downright giddy. It’s not as powerful as a university degree, but it is something I would be able to put on my résumé and show potential employers. I’m still against for-profit schools, but I’m thankful to be able to do this.
Speaking of for-profit schools, ITT Tech went under recently, leaving a ton of students with a loss of their tuition and without degrees. I was shocked to hear they were established 50 years ago. I had no idea they had been around that long.
Mathematics
I completed statistics on Khan Academy. I’ll definitely need to take a more advanced class later on because this was more of a supplemental learning. It was great and refreshed my memory on a lot of statistical topics that will help with my analyses, but it wasn’t as in depth as their other math courses. I’ve read that Udacity has the go-to statistics class, so I’ll check that out, probably after completing linear algebra.
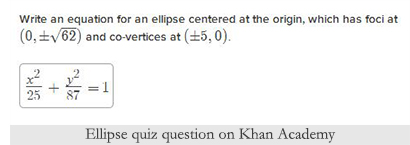
Now I’m back on track with precalculus. I reviewed some trigonometry and sinusoidal functions, then moved on to ellipse and parabola equations. I still need to learn hyperbolas and then I’ll move on to vectors and matrices. This should coincide perfectly with my machine learning specialization, as long as I won’t need more advanced knowledge of those topics just yet.
Conclusion
I’m sorry for the longer journal entry today. I feel as though I haven’t had anything to write the past two weeks, so it’s nice to have something exciting to discuss. I'm happy with my current progress and I’m taking the perfect courses right now.
Thank you for coming along on my journey. I hope that you are reaching for your dreams, whatever they are. Take care and I’ll see you in a week!

Author and hobby digital artist. Barry aspires to become a data scientist and better himself as a person.